Sau đây là một ví dụ về biểu đồ đường xu hướng hàm mũ. Chúng ta đã thấy cấu hình được sử dụng để vẽ biểu đồ này trong chương Cú pháp cấu hình biểu đồ của Google . Vì vậy, hãy xem ví dụ đầy đủ.
Cấu hình
Chúng tôi đã sử dụng cấu hình đường xu hướng để hiển thị sơ đồ đường xu hướng.
var options = {
   trendlines: { 0: {type: 'exponential'} }    // Draw a trendline for data series 0.
};
Ví dụ
googlecharts_trendlines_exponential.htm
<html>
   <head>
      <title>Google Charts dongthoigian</title>
      <script type = "text/javascript" src = "https://www.gstatic.com/charts/loader.js">
      </script>
      <script type = "text/javascript" src = "https://www.google.com/jsapi">
      </script>
      <script type = "text/javascript">
         google.charts.load('current', {packages: ['corechart']});
      </script>
   </head>

   <body>
      <div id = "container" style = "width: 550px; height: 400px; margin: 0 auto">
      </div>
      <script language = "JavaScript">
         function drawChart() {
            // Define the chart to be drawn.
            var data = new google.visualization.DataTable();
            data.addColumn('number', 'Age');
            data.addColumn('number', 'Weight');
            data.addRows([
               [ 8,      12],
               [ 4,      5.5],
               [ 11,     14],
               [ 4,      5],
               [ 3,      3.5],
               [ 6.5,    7]
            ]);

            // Set chart options
            var options = {
               'title':'Age vs Weight',
               'width':550,
               'height':400,
               'legend': 'none',
               trendlines: { 0: {type: 'exponential'} }   // Draw a trendline for data series 0.
            };

            // Instantiate and draw the chart.
            var chart = new google.visualization.ScatterChart(document.getElementById('container'));
            chart.draw(data, options);
         }
         google.charts.setOnLoadCallback(drawChart);
      </script>
   </body>
</html>
Xác minh kết quả.

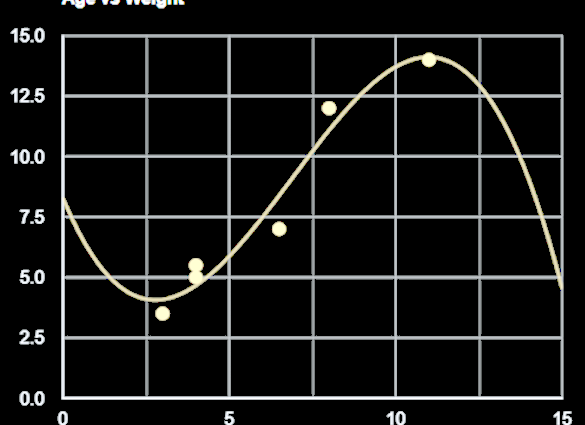
Biểu đồ Google – Đường xu hướng đa thức
Sau đây là một ví dụ về biểu đồ đường xu hướng đa thức. Chúng ta đã thấy cấu hình được sử dụng để vẽ biểu đồ này trong chương Cú pháp cấu hình biểu đồ của Google . Vì vậy, hãy xem ví dụ đầy đủ.
Cấu hình
Chúng tôi đã sử dụng cấu hình đường xu hướng để hiển thị sơ đồ đường xu hướng.
var options = {
   trendlines: { 0: {
      type: 'polynomial',
      degree: 3,
      visibleInLegend: true,}
   }	  // Draw a trendline for data series 0.
};
Ví dụ
googlecharts_trendlines_polynomial.htm
<html>
   <head>
      <title>Google Charts dongthoigian</title>
      <script type = "text/javascript" src = "https://www.gstatic.com/charts/loader.js">
      </script>
      <script type = "text/javascript" src = "https://www.google.com/jsapi">
      </script>
      <script type = "text/javascript">
         google.charts.load('current', {packages: ['corechart']});
      </script>
   </head>

   <body>
      <div id = "container" style = "width: 550px; height: 400px; margin: 0 auto">
      </div>
      <script language = "JavaScript">
         function drawChart() {
            // Define the chart to be drawn.
            var data = new google.visualization.DataTable();
            data.addColumn('number', 'Age');
            data.addColumn('number', 'Weight');
            data.addRows([
               [ 8,      12],
               [ 4,      5.5],
               [ 11,     14],
               [ 4,      5],
               [ 3,      3.5],
               [ 6.5,    7]
            ]);

            // Set chart options
            var options = {
               'title':'Age vs Weight',
               'width':550,
               'height':400,
               'legend': 'none',
               trendlines: { 0:
                  {
                     type: 'polynomial',
                     degree: 3,
                     visibleInLegend: true,
                  }
               }	// Draw a trendline for data series 0.
            };

            // Instantiate and draw the chart.
            var chart = new google.visualization.ScatterChart(document.getElementById('container'));
            chart.draw(data, options);
         }
         google.charts.setOnLoadCallback(drawChart);
      </script>
   </body>
</html>
Xác minh kết quả.
