Sau đây là một ví dụ về biểu đồ thanh được nhóm. Chúng ta đã thấy cấu hình được sử dụng để vẽ biểu đồ này trong chương Cú pháp cấu hình biểu đồ của Google . Vì vậy, hãy xem ví dụ đầy đủ.
Ví dụ
googlecharts_bar_grouped.htm Bản thử trực tiếp
<html>
   <head>
      <title>Google Charts dongthoigianl</title>
      <script type = "text/javascript" src = "https://www.gstatic.com/charts/loader.js">
      </script>
      <script type = "text/javascript">
         google.charts.load('current', {packages: ['corechart']});
      </script>
   </head>

   <body>
      <div id = "container" style = "width: 550px; height: 400px; margin: 0 auto">
      </div>
      <script language = "JavaScript">
         function drawChart() {
            // Define the chart to be drawn.
            var data = google.visualization.arrayToDataTable([
               ['Year', 'Asia', 'Europe'],
               ['2012',  900,      390],
               ['2013',  1000,      400],
               ['2014',  1170,      440],
               ['2015',  1250,       480],
               ['2016',  1530,      540]
            ]);

            var options = {title: 'Population (in millions)'};

            // Instantiate and draw the chart.
            var chart = new google.visualization.BarChart(document.getElementById('container'));
            chart.draw(data, options);
         }
         google.charts.setOnLoadCallback(drawChart);
      </script>
   </body>
</html>
Kết quả Xác minh kết quả.

Biểu đồ Google – Biểu đồ thanh xếp chồng
Sau đây là một ví dụ về biểu đồ thanh xếp chồng. Chúng ta đã thấy cấu hình được sử dụng để vẽ biểu đồ này trong chương Cú pháp cấu hình biểu đồ của Google . Vì vậy, hãy xem ví dụ đầy đủ.
Cấu hình
Chúng tôi đã sử dụng cấu hình isStacked để hiển thị biểu đồ xếp chồng
// Set chart options
var options = {
   isStacked: true
};
<html>
   <head>
      <title>Google Charts dongthoigianl</title>
      <script type = "text/javascript" src = "https://www.gstatic.com/charts/loader.js">
      </script>
      <script type = "text/javascript">
         google.charts.load('current', {packages: ['corechart']});
      </script>
   </head>

   <body>
      <div id = "container" style = "width: 550px; height: 400px; margin: 0 auto">
      </div>
      <script language = "JavaScript">
         function drawChart() {
            // Define the chart to be drawn.
            var data = google.visualization.arrayToDataTable([
               ['Year', 'Asia', 'Europe'],
               ['2012',  900,      390],
               ['2013',  1000,      400],
               ['2014',  1170,      440],
               ['2015',  1250,       480],
               ['2016',  1530,      540]
            ]);

            var options = {title: 'Population (in millions)', isStacked:true};

            // Instantiate and draw the chart.
            var chart = new google.visualization.BarChart(document.getElementById('container'));
            chart.draw(data, options);
         }
         google.charts.setOnLoadCallback(drawChart);
      </script>
   </body>
</html>
Kết quả Xác minh kết quả.

Biểu đồ Google – Biểu đồ thanh xếp chồng phủ định
Sau đây là ví dụ về biểu đồ thanh xếp chồng âm. Chúng ta đã thấy cấu hình được sử dụng để vẽ biểu đồ này trong chương Cú pháp cấu hình biểu đồ của Google . Vì vậy, hãy xem ví dụ đầy đủ.
Cấu hình
Chúng tôi đã sử dụng cấu hình isStacked để hiển thị biểu đồ xếp chồng
// Set chart options
var options = {
   isStacked: true
};
<html>
   <head>
      <title>Google Charts dongthoigian</title>
      <script type = "text/javascript" src = "https://www.gstatic.com/charts/loader.js">
      </script>
      <script type = "text/javascript">
         google.charts.load('current', {packages: ['corechart']});
      </script>
   </head>

   <body>
      <div id = "container" style = "width: 550px; height: 400px; margin: 0 auto">
      </div>
      <script language = "JavaScript">
         function drawChart() {
            // Define the chart to be drawn.
            var data = google.visualization.arrayToDataTable([
               ['Year', 'Sales', 'Expenses'],
               ['2012',  900,      390],
               ['2013',  -1000,      400],
               ['2014',  -1170,      440],
               ['2015',  1250,       480],
               ['2016',  1530,      540]
            ]);

            var options = {
               title: 'Company Performance',
               isStacked:true
            };

            // Instantiate and draw the chart.
            var chart = new google.visualization.BarChart(document.getElementById('container'));
            chart.draw(data, options);
         }
         google.charts.setOnLoadCallback(drawChart);
      </script>
   </body>
</html>
Kết quả Xác minh kết quả

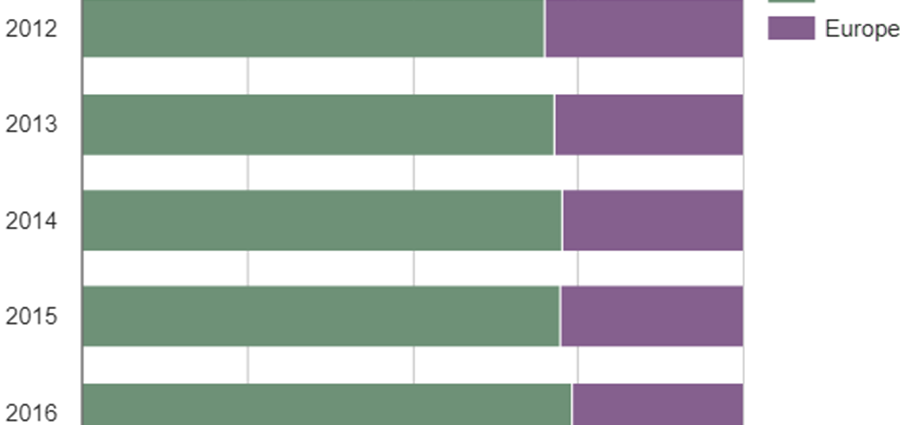
Biểu đồ Google – Biểu đồ thanh xếp chồng 100%
Sau đây là ví dụ về biểu đồ thanh xếp chồng 100%. Chúng ta đã thấy cấu hình được sử dụng để vẽ biểu đồ này trong chương Cú pháp cấu hình biểu đồ của Google . Vì vậy, hãy xem ví dụ đầy đủ.
Cấu hình
// Set chart options
var options = {
   isStacked: 'percent'
};
<html>
   <head>
      <title>Google Charts dongthoigian</title>
      <script type = "text/javascript" src = "https://www.gstatic.com/charts/loader.js"></script>
      <script type = "text/javascript">
         google.charts.load('current', {packages: ['corechart']});
      </script>
   </head>

   <body>
      <div id = "container" style = "width: 550px; height: 400px; margin: 0 auto"></div>
      <script language = "JavaScript">
         function drawChart() {
            // Define the chart to be drawn.
            var data = google.visualization.arrayToDataTable([
               ['Year', 'Asia', 'Europe'],
               ['2012',  900,      390],
               ['2013',  1000,      400],
               ['2014',  1170,      440],
               ['2015',  1250,       480],
               ['2016',  1530,      540]
            ]);

            var options = {
               title: 'Population (in millions)',
               isStacked:'percent'
            };

            // Instantiate and draw the chart.
            var chart = new google.visualization.BarChart(document.getElementById('container'));
            chart.draw(data, options);
         }
         google.charts.setOnLoadCallback(drawChart);
      </script>
   </body>
</html>
Kết quả Xác minh kết quả.

Biểu đồ Google – Biểu đồ thanh vật liệu
Sau đây là một ví dụ về biểu đồ thanh vật liệu. Chúng ta đã thấy cấu hình được sử dụng để vẽ biểu đồ này trong chương Cú pháp cấu hình biểu đồ của Google . Vì vậy, hãy xem ví dụ đầy đủ.
Cấu hình
Chúng tôi đã sử dụng lớp Bar để hiển thị biểu đồ vật liệu.
//classic chart
var chart = new google.visualization.BarChart(document.getElementById('container'));
//Material chart
var chart = new google.charts.Bar(document.getElementById('container'));
//set the bar to be horizontal using options
var options = {
   bars: 'horizontal'
};
Ví dụ
googlecharts_bar_material.htm
Bản thử trực tiếp
<html>
   <head>
      <title>Google Charts dongthoigian</title>
      <script type = "text/javascript" src = "https://www.gstatic.com/charts/loader.js">
      </script>
      <script type = "text/javascript">
         google.charts.load('current', {packages: ['corechart','bar']});
      </script>
   </head>

   <body>
      <div id = "container" style = "width: 550px; height: 400px; margin: 0 auto">
      </div>
      <script language = "JavaScript">
         function drawChart() {
            // Define the chart to be drawn.
            var data = google.visualization.arrayToDataTable([
               ['Year', 'Asia', 'Europe'],
               ['2012',  900,      390],
               ['2013',  1000,      400],
               ['2014',  1170,      440],
               ['2015',  1250,       480],
               ['2016',  1530,      540]
            ]);

            var options = {title: 'Population (in millions)', bars: 'horizontal'};

            // Instantiate and draw the chart.
            var chart = new google.charts.Bar(document.getElementById('container'));
            chart.draw(data, options);
         }
         google.charts.setOnLoadCallback(drawChart);
      </script>
   </body>
</html>
Kết quả Xác minh kết quả.
