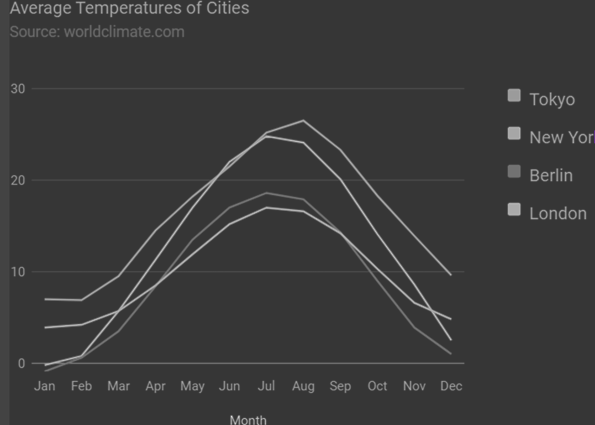
Sau đây là ví dụ về biểu đồ đường cơ bản với các đường cong mượt mà. Chúng ta đã thấy cấu hình được sử dụng để vẽ biểu đồ này trong chương Cú pháp cấu hình biểu đồ của Google . Vì vậy, hãy xem ví dụ đầy đủ.
Cấu hình
Chúng tôi đã thêm cấu hình màu nền để thay đổi màu nền mặc định.
// Set chart options
var options = {
   curveType: 'function'
};
Ví dụ
googlecharts_line_curve.htm
   <head>
      <title>Google Charts dongthoigian</title>
      <script type = "text/javascript" src = "https://www.gstatic.com/charts/loader.js"></script>
      <script type = "text/javascript">
         google.charts.load('current', {packages: ['corechart','line']});
      </script>
   </head>

   <body>
      <div id = "container" style = "width: 550px; height: 400px; margin: 0 auto">
      </div>
      <script language = "JavaScript">
         function drawChart() {
            // Define the chart to be drawn.
            var data = new google.visualization.DataTable();
            data.addColumn('string', 'Month');
            data.addColumn('number', 'Tokyo');
            data.addColumn('number', 'New York');
            data.addColumn('number', 'Berlin');
            data.addColumn('number', 'London');
            data.addRows([
               ['Jan',  7.0, -0.2, -0.9, 3.9],
               ['Feb',  6.9, 0.8, 0.6, 4.2],
               ['Mar',  9.5,  5.7, 3.5, 5.7],
               ['Apr',  14.5, 11.3, 8.4, 8.5],
               ['May',  18.2, 17.0, 13.5, 11.9],
               ['Jun',  21.5, 22.0, 17.0, 15.2],

               ['Jul',  25.2, 24.8, 18.6, 17.0],
               ['Aug',  26.5, 24.1, 17.9, 16.6],
               ['Sep',  23.3, 20.1, 14.3, 14.2],
               ['Oct',  18.3, 14.1, 9.0, 10.3],
               ['Nov',  13.9,  8.6, 3.9, 6.6],
               ['Dec',  9.6,  2.5,  1.0, 4.8]
            ]);

            // Set chart options
            var options = {'title' : 'Average Temperatures of Cities',
               hAxis: {
                  title: 'Month'
               },
               vAxis: {
                  title: 'Temperature'
               },
               'width':550,
               'height':400,
               curveType: 'function'
            };

            // Instantiate and draw the chart.
            var chart = new google.visualization.LineChart(document.getElementById('container'));
            chart.draw(data, options);
         }
         google.charts.setOnLoadCallback(drawChart);
      </script>
   </body>
</html>
Xác minh kết quả.

Biểu đồ của Google – Biểu đồ đường vật liệu
Sau đây là một ví dụ về biểu đồ dòng vật liệu. Chúng ta đã thấy cấu hình được sử dụng để vẽ biểu đồ này trong chương Cú pháp cấu hình biểu đồ của Google . Vì vậy, hãy xem ví dụ đầy đủ.
Cấu hình
Chúng tôi đã sử dụng lớp Line để hiển thị biểu đồ vật liệu.
//classic chartvar chart = new google.visualization.LineChart(document.getElementById(‘container’));
//Material chartvar chart = new google.charts.Line(document.getElementById(‘container’));
Ví dụ
googlecharts_line_material.htm
<html>
   <head>
      <title>Google Charts dongthoigian</title>
      <script type = "text/javascript" src = "https://www.gstatic.com/charts/loader.js"></script>
      <script type = "text/javascript">
         google.charts.load('current', {packages: ['corechart','line']});
      </script>
   </head>

   <body>
      <div id = "container" style = "width: 550px; height: 400px; margin: 0 auto">
      </div>
      <script language = "JavaScript">
         function drawChart() {
            // Define the chart to be drawn.
            var data = new google.visualization.DataTable();
            data.addColumn('string', 'Month');
            data.addColumn('number', 'Tokyo');
            data.addColumn('number', 'New York');
            data.addColumn('number', 'Berlin');
            data.addColumn('number', 'London');
            data.addRows([
               ['Jan',  7.0, -0.2, -0.9, 3.9],
               ['Feb',  6.9, 0.8, 0.6, 4.2],
               ['Mar',  9.5,  5.7, 3.5, 5.7],
               ['Apr',  14.5, 11.3, 8.4, 8.5],
               ['May',  18.2, 17.0, 13.5, 11.9],
               ['Jun',  21.5, 22.0, 17.0, 15.2],

               ['Jul',  25.2, 24.8, 18.6, 17.0],
               ['Aug',  26.5, 24.1, 17.9, 16.6],
               ['Sep',  23.3, 20.1, 14.3, 14.2],
               ['Oct',  18.3, 14.1, 9.0, 10.3],
               ['Nov',  13.9,  8.6, 3.9, 6.6],
               ['Dec',  9.6,  2.5,  1.0, 4.8]
            ]);

            // Set chart options
            var options = {
               chart: {
                  title: 'Average Temperatures of Cities',
                  subtitle: 'Source: worldclimate.com'
               },
               hAxis: {
                  title: 'Month',
               },
               vAxis: {
                  title: 'Temperature',
               },
               'width':550,
               'height':400
            };

            // Instantiate and draw the chart.
            var chart = new google.charts.Line(document.getElementById('container'));
            chart.draw(data, options);
         }
         google.charts.setOnLoadCallback(drawChart);
      </script>
   </body>
</html>
Xác minh kết quả.

Biểu đồ Google – Biểu đồ dòng X hàng đầu
Sau đây là ví dụ về biểu đồ đường vật liệu có trục x ở trên. Chúng ta đã thấy cấu hình được sử dụng để vẽ biểu đồ này trong chương Cú pháp cấu hình biểu đồ của Google . Vì vậy, hãy xem ví dụ đầy đủ.
Cấu hình
Chúng tôi đã sử dụng cấu hình axes.x ở đây để có trục x ở đầu biểu đồ.
// Set chart options
var options = {
   axes: {
      x: {
         0: {side: 'top'}
      }
   }
};
Ví dụ
googlecharts_line_topx.htm
<html>
   <head>
      <title>Google Charts dongthoigian</title>
      <script type = "text/javascript" src = "https://www.gstatic.com/charts/loader.js">
      </script>
      <script type = "text/javascript">
         google.charts.load('current', {packages: ['corechart','line']});
      </script>
   </head>

   <body>
      <div id = "container" style = "width: 550px; height: 400px; margin: 0 auto">
      </div>
      <script language = "JavaScript">
         function drawChart() {
            // Define the chart to be drawn.
            var data = new google.visualization.DataTable();
            data.addColumn('string', 'Month');
            data.addColumn('number', 'Tokyo');
            data.addColumn('number', 'New York');
            data.addColumn('number', 'Berlin');
            data.addColumn('number', 'London');
            data.addRows([
               ['Jan',  7.0, -0.2, -0.9, 3.9],
               ['Feb',  6.9, 0.8, 0.6, 4.2],
               ['Mar',  9.5,  5.7, 3.5, 5.7],
               ['Apr',  14.5, 11.3, 8.4, 8.5],
               ['May',  18.2, 17.0, 13.5, 11.9],
               ['Jun',  21.5, 22.0, 17.0, 15.2],

               ['Jul',  25.2, 24.8, 18.6, 17.0],
               ['Aug',  26.5, 24.1, 17.9, 16.6],
               ['Sep',  23.3, 20.1, 14.3, 14.2],
               ['Oct',  18.3, 14.1, 9.0, 10.3],
               ['Nov',  13.9,  8.6, 3.9, 6.6],
               ['Dec',  9.6,  2.5,  1.0, 4.8]
            ]);

            // Set chart options
            var options = {
               chart: {
                  title: 'Average Temperatures of Cities',
                  subtitle: 'Source: worldclimate.com'
               },
               hAxis: {
                  title: 'Month',
               },
               vAxis: {
                  title: 'Temperature',
               },
               'width':550,
               'height':400,
               axes: {
                  x: {
                     0: {side: 'top'}
                  }
               }
            };

            // Instantiate and draw the chart.
            var chart = new google.charts.Line(document.getElementById('container'));
            chart.draw(data, options);
         }
         google.charts.setOnLoadCallback(drawChart);
      </script>
   </body>
</html>
Xác minh kết quả.
