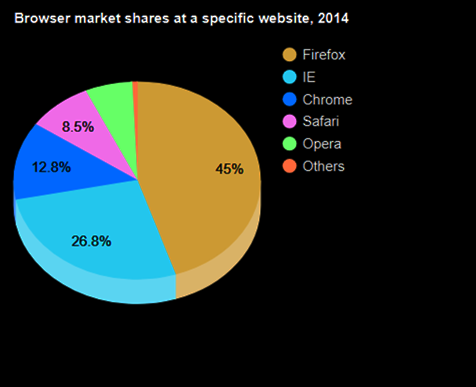
Sau đây là ví dụ về biểu đồ 3d Pie. Chúng ta đã thấy cấu hình được sử dụng để vẽ biểu đồ này trong chương Cú pháp cấu hình biểu đồ của Google . Vì vậy, hãy xem ví dụ đầy đủ.
Cấu hình
Chúng tôi đã sử dụng cấu hình is3D để đặt biểu đồ hình tròn làm biểu đồ bánh rán.
// Set chart options
var options = {
   is3D:true
};
Ví dụ
googlecharts_pie_3d.htm
<html>
   <head>
      <title>Google Charts donthoigian</title>
      <script type = "text/javascript" src = "https://www.gstatic.com/charts/loader.js">
      </script>
      <script type = "text/javascript">
         google.charts.load('current', {packages: ['corechart']});
      </script>
   </head>

   <body>
      <div id = "container" style = "width: 550px; height: 400px; margin: 0 auto">
      </div>
      <script language = "JavaScript">
         function drawChart() {
            // Define the chart to be drawn.
            var data = new google.visualization.DataTable();
            data.addColumn('string', 'Browser');
            data.addColumn('number', 'Percentage');
            data.addRows([
               ['Firefox', 45.0],
               ['IE', 26.8],
               ['Chrome', 12.8],
               ['Safari', 8.5],
               ['Opera', 6.2],
               ['Others', 0.7]
            ]);

            // Set chart options
            var options = {
               'title':'Browser market shares at a specific website, 2014',
               'width':550,
               'height':400,
               is3D:true
            };

            // Instantiate and draw the chart.
            var chart = new google.visualization.PieChart(document.getElementById('container'));
            chart.draw(data, options);
         }
         google.charts.setOnLoadCallback(drawChart);
      </script>
   </body>
</html>
Xác minh kết quả.
Biểu đồ của Google – Biểu đồ hình tròn bùng nổ
Sau đây là một ví dụ về biểu đồ Pie đã được giải mã. Chúng ta đã thấy cấu hình được sử dụng để vẽ biểu đồ này trong chương Cú pháp cấu hình biểu đồ của Google . Vì vậy, hãy xem ví dụ đầy đủ.
Cấu hình
Chúng tôi đã sử dụng các lát cắt có cấu hình bù để đặt biểu đồ hình tròn dưới dạng biểu đồ đã chia nhỏ
// Set chart options
var options = {
   slices: {
      1: {offset: 0.2},
      3: {offset: 0.3}
   }
};
Ví dụ
googlecharts_pie_exploded.htm
<html>
   <head>
      <title>Google Charts dongthoigian</title>
      <script type = "text/javascript" src = "https://www.gstatic.com/charts/loader.js">
      </script>
      <script type = "text/javascript">
         google.charts.load('current', {packages: ['corechart']});
      </script>
   </head>

   <body>
      <div id = "container" style = "width: 550px; height: 400px; margin: 0 auto">
      </div>
      <script language = "JavaScript">
         function drawChart() {
            // Define the chart to be drawn.
            var data = new google.visualization.DataTable();
            data.addColumn('string', 'Browser');
            data.addColumn('number', 'Percentage');
            data.addRows([
               ['Firefox', 45.0],
               ['IE', 26.8],
               ['Chrome', 12.8],
               ['Safari', 8.5],
               ['Opera', 6.2],
               ['Others', 0.7]
            ]);

            // Set chart options
            var options = {
               'title':'Browser market shares at a specific website, 2014',
               'width':550,
               'height':400,
               slices: {
                  1: {offset: 0.2},
                  3: {offset: 0.3}
               }
            };

            // Instantiate and draw the chart.
            var chart = new google.visualization.PieChart(document.getElementById('container'));
            chart.draw(data, options);
         }
         google.charts.setOnLoadCallback(drawChart);
      </script>
   </body>
</html>
Xác minh kết quả.

Biểu đồ của Google – Biểu đồ Sankey
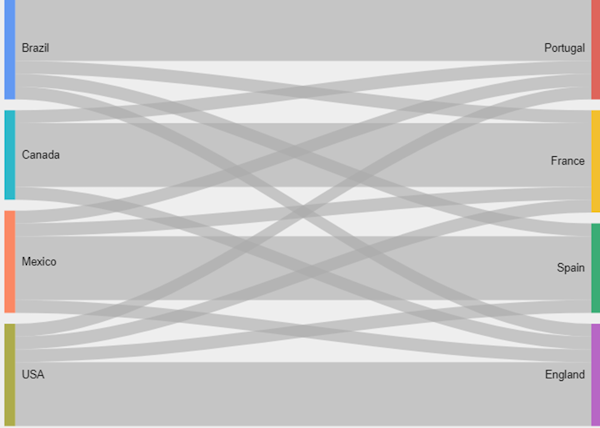
Biểu đồ Google – Biểu đồ Sankey cơ bản
Sau đây là một ví dụ về sơ đồ sankey cơ bản. Chúng ta đã thấy cấu hình được sử dụng để vẽ biểu đồ này trong chương Cú pháp cấu hình biểu đồ của Google . Vì vậy, hãy xem ví dụ đầy đủ.
Cấu hình
Chúng tôi đã sử dụng lớp Sankey để hiển thị sơ đồ sankey.
//Map chartvar chart = new google.visualization.Sankey(document.getElementById(‘container’));
Ví dụ
googlecharts_sankey_basic.htm
<html>
   <head>
      <title>Google Charts dongthoigian</title>
      <script type = "text/javascript" src = "https://www.gstatic.com/charts/loader.js">
      </script>
      <script type = "text/javascript" src = "https://www.google.com/jsapi"></script>
      <script type = "text/javascript">
         google.charts.load('current', {packages: ['sankey']});
      </script>
   </head>

   <body>
      <div id = "container" style = "width: 550px; height: 400px; margin: 0 auto">
      </div>
      <script language = "JavaScript">
         function drawChart() {
            // Define the chart to be drawn.
            var data = new google.visualization.DataTable();
            data.addColumn('string', 'From');
            data.addColumn('string', 'To');
            data.addColumn('number', 'Weight');

            data.addRows([
               [ 'Brazil', 'Portugal', 5 ],
               [ 'Brazil', 'France', 1 ],
               [ 'Brazil', 'Spain', 1 ],
               [ 'Brazil', 'England', 1 ],

               [ 'Canada', 'Portugal', 1 ],
               [ 'Canada', 'France', 5 ],
               [ 'Canada', 'England', 1 ],

               [ 'Mexico', 'Portugal', 1 ],
               [ 'Mexico', 'France', 1 ],
               [ 'Mexico', 'Spain', 5 ],
               [ 'Mexico', 'England', 1 ],

               [ 'USA', 'Portugal', 1 ],
               [ 'USA', 'France', 1 ],
               [ 'USA', 'Spain', 1 ],
               [ 'USA', 'England', 5 ]
            ]);

            // Set chart options
            var options = {width: 550};

            // Instantiate and draw the chart.
            var chart = new google.visualization.Sankey(document.getElementById('container'));
            chart.draw(data, options);
         }
         google.charts.setOnLoadCallback(drawChart);
      </script>
   </body>
</html>
Xác minh kết quả.
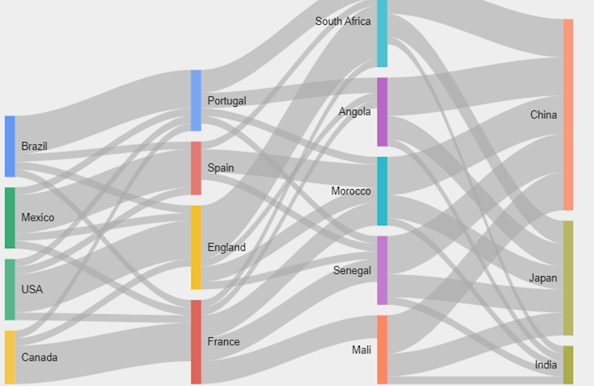
Biểu đồ Google – Biểu đồ Sankey đa cấp
Sau đây là một ví dụ về sơ đồ sankey với nhiều cấp độ. Chúng ta đã thấy cấu hình được sử dụng để vẽ biểu đồ này trong chương Cú pháp cấu hình biểu đồ của Google . Vì vậy, hãy xem ví dụ đầy đủ.
Cấu hình
Chúng tôi đã sử dụng lớp Sankey để hiển thị sơ đồ sankey. //Sankey chartvar chart = new google.visualization.Sankey(document.getElementById(‘container’));
Ví dụ
googlecharts_sankey_multilevel.htm
<html>
   <head>
      <title>Google Charts dongthoigian</title>
      <script type = "text/javascript" src = "https://www.gstatic.com/charts/loader.js">
      </script>
      <script type = "text/javascript" src = "https://www.google.com/jsapi">
      </script>
      <script type = "text/javascript">
         google.charts.load('current', {packages: ['sankey']});
      </script>
   </head>

   <body>
      <div id = "container" style = "width: 550px; height: 400px; margin: 0 auto">
      </div>
      <script language = "JavaScript">
         function drawChart() {
            // Define the chart to be drawn.
            var data = new google.visualization.DataTable();
            data.addColumn('string', 'From');
            data.addColumn('string', 'To');
            data.addColumn('number', 'Weight');

            data.addRows([
               [ 'Brazil', 'Portugal', 5 ],
               [ 'Brazil', 'France', 1 ],
               [ 'Brazil', 'Spain', 1 ],
               [ 'Brazil', 'England', 1 ],

               [ 'Canada', 'Portugal', 1 ],
               [ 'Canada', 'France', 5 ],
               [ 'Canada', 'England', 1 ],

               [ 'Mexico', 'Portugal', 1 ],
               [ 'Mexico', 'France', 1 ],
               [ 'Mexico', 'Spain', 5 ],
               [ 'Mexico', 'England', 1 ],

               [ 'USA', 'Portugal', 1 ],
               [ 'USA', 'France', 1 ],
               [ 'USA', 'Spain', 1 ],
               [ 'USA', 'England', 5 ],

               [ 'Portugal', 'Angola', 2 ],
               [ 'Portugal', 'Senegal', 1 ],
               [ 'Portugal', 'Morocco', 1 ],
               [ 'Portugal', 'South Africa', 3 ],

               [ 'France', 'Angola', 1 ],
               [ 'France', 'Senegal', 3 ],
               [ 'France', 'Mali', 3 ],
               [ 'France', 'Morocco', 3 ],
               [ 'France', 'South Africa', 1 ],

               [ 'Spain', 'Senegal', 1 ],
               [ 'Spain', 'Morocco', 3 ],
               [ 'Spain', 'South Africa', 1 ],

               [ 'England', 'Angola', 1 ],
               [ 'England', 'Senegal', 1 ],
               [ 'England', 'Morocco', 2 ],
               [ 'England', 'South Africa', 7 ],

               [ 'South Africa', 'China', 5 ],
               [ 'South Africa', 'India', 1 ],
               [ 'South Africa', 'Japan', 3 ],

               [ 'Angola', 'China', 5 ],
               [ 'Angola', 'India', 1 ],
               [ 'Angola', 'Japan', 3 ],

               [ 'Senegal', 'China', 5 ],
               [ 'Senegal', 'India', 1 ],
               [ 'Senegal', 'Japan', 3 ],

               [ 'Mali', 'China', 5 ],
               [ 'Mali', 'India', 1 ],
               [ 'Mali', 'Japan', 3 ],

               [ 'Morocco', 'China', 5 ],
               [ 'Morocco', 'India', 1 ],
               [ 'Morocco', 'Japan', 3 ]
            ]);

            // Set chart options
            var options = {width: 550};

            // Instantiate and draw the chart.
            var chart = new google.visualization.Sankey(document.getElementById('container'));
            chart.draw(data, options);
         }
         google.charts.setOnLoadCallback(drawChart);
      </script>
   </body>
</html>
Xác minh kết quả
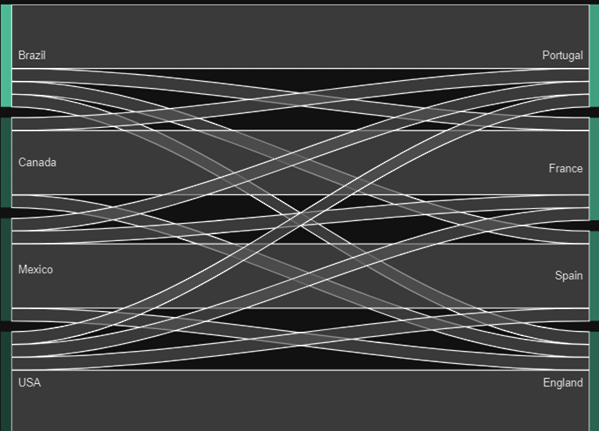
Sau đây là ví dụ về sơ đồ sankey tùy chỉnh. Chúng ta đã thấy cấu hình được sử dụng để vẽ biểu đồ này trong chương Cú pháp cấu hình biểu đồ của Google . Vì vậy, hãy xem ví dụ đầy đủ.
Cấu hình
Chúng tôi đã sử dụng cấu hình sankey để tùy chỉnh sơ đồ sankey.
// Set chart options
var options = {
   width: 550,
   sankey: {
      node: { colors: [ '#a61d4c' ] },
      link: { color: { stroke: 'black', strokeWidth: 1 } },
   }
};
Ví dụ
googlecharts_sankey_customized.htm
<html>
   <head>
      <title>Google Charts dongthoigian</title>
      <script type = "text/javascript" src = "https://www.gstatic.com/charts/loader.js">
      </script>
      <script type = "text/javascript" src = "https://www.google.com/jsapi">
      </script>
      <script type = "text/javascript">
         google.charts.load('current', {packages: ['sankey']});
      </script>
   </head>

   <body>
      <div id = "container" style = "width: 550px; height: 400px; margin: 0 auto">
      </div>
      <script language = "JavaScript">
         function drawChart() {
            // Define the chart to be drawn.
            var data = new google.visualization.DataTable();
            data.addColumn('string', 'From');
            data.addColumn('string', 'To');
            data.addColumn('number', 'Weight');

            data.addRows([
               [ 'Brazil', 'Portugal', 5 ],
               [ 'Brazil', 'France', 1 ],
               [ 'Brazil', 'Spain', 1 ],
               [ 'Brazil', 'England', 1 ],

               [ 'Canada', 'Portugal', 1 ],
               [ 'Canada', 'France', 5 ],
               [ 'Canada', 'England', 1 ],

               [ 'Mexico', 'Portugal', 1 ],
               [ 'Mexico', 'France', 1 ],
               [ 'Mexico', 'Spain', 5 ],
               [ 'Mexico', 'England', 1 ],

               [ 'USA', 'Portugal', 1 ],
               [ 'USA', 'France', 1 ],
               [ 'USA', 'Spain', 1 ],
               [ 'USA', 'England', 5 ]
            ]);

            // Set chart options
            var options = {
               width: 550,
               sankey: {
                  node: { colors: [ '#a61d4c' ] },
                  link: {
                     color: {
                        stroke: 'black',
                        strokeWidth: 1
                     }
                  },
               }
            };

            // Instantiate and draw the chart.
            var chart = new google.visualization.Sankey(document.getElementById('container'));
            chart.draw(data, options);
         }
         google.charts.setOnLoadCallback(drawChart);
      </script>
   </body>
</html>
Xác minh kết quả.